National Geographic maps track rising and falling COVID-19 cases

Tuesday, May 12, 2020

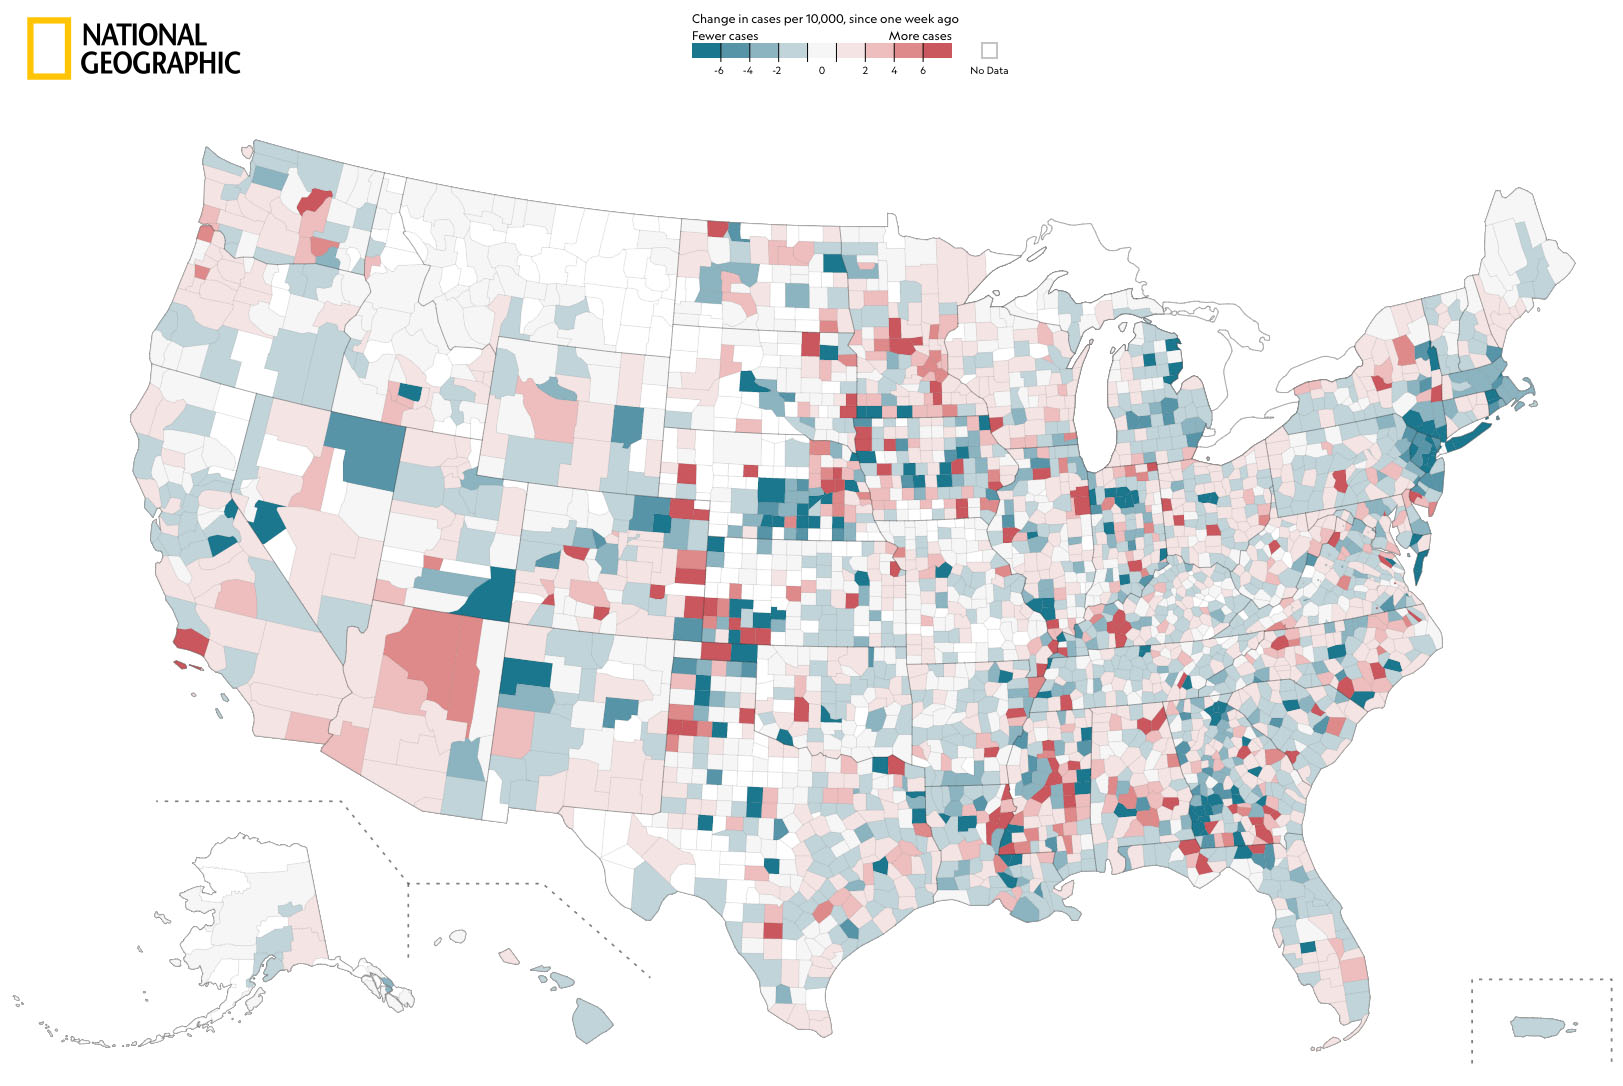
So far, many of the national maps comparing COVID-19 cases and deaths have focused on where the disease is growing.
A new set of data-driven maps by National Geographic show regions of the country where the cases and deaths rose -- and fell -- over the last week.
National Geographic
The maps give viewers a sense of whether your county is on an upward or downward trajectory, one of the key indicators that government officials and medical experts are watching closely as they assess how long to keep social distancing restrictions in place.
National Geographic examines the trend using cases and deaths per capita, rather than raw numbers.
To delve into and explore the series of exclusive maps, a prominent link, visit NatGeo.com.
Copyright © 2026 KABC Television, LLC. All rights reserved.